Pennsylvania’s Archaeological Predictive Model: Unfinished Business

January 2019

Back in 2015, a statewide archaeological predictive model was created that estimated high, moderate, and low probability areas for pre-contact archaeological sites (Harris et al 2015).  At the time of publication, Pennsylvania became the second state in the US to have such a statewide model, the other being Minnesota. Prior to introduction of the model and its ultimate disposition as layers within the Cultural Resources GIS system, project-specific predictive models had been developed, but nothing on this scale had been attempted.  But, building a model and trusting a model are quite different things.  Since 2015, both the Pennsylvania State Historic Preservation Office and the Pennsylvania Department of Transportation have made forays into testing the model against site data collected after the model was created.  These well intentioned peeks under the hood offer some insights regarding the utility of the model, but do not address the key question, “Can archaeologists use it?”

A Bit of History

In 2013, FHWA, PennDOT and its consultant URS Corporation (now AECOM) partnered with the PHMC and FHWA to produce a statewide archaeological predictive model for sites related to Native Peoples in Pennsylvania prior to European contact.  The resulting model creates two GIS (geographic information system) sensitivity layers that show where there is a high probability for these sites and where there is a moderate probability for these sites.  The remaining space is interpreted as low probability.  The model results are currently being used by metropolitan and rural planning organizations (MPO/RPO) in planning transportation projects.  The model provides inputs for PennDOT Connect Level 2 screening forms, and is an improvement over previous inputs that were based only on proximity to known archaeological sites.  In addition, the predictive model will be used to choose alternatives in larger EIS-level projects, rather than independently developing a predictive model for each project.

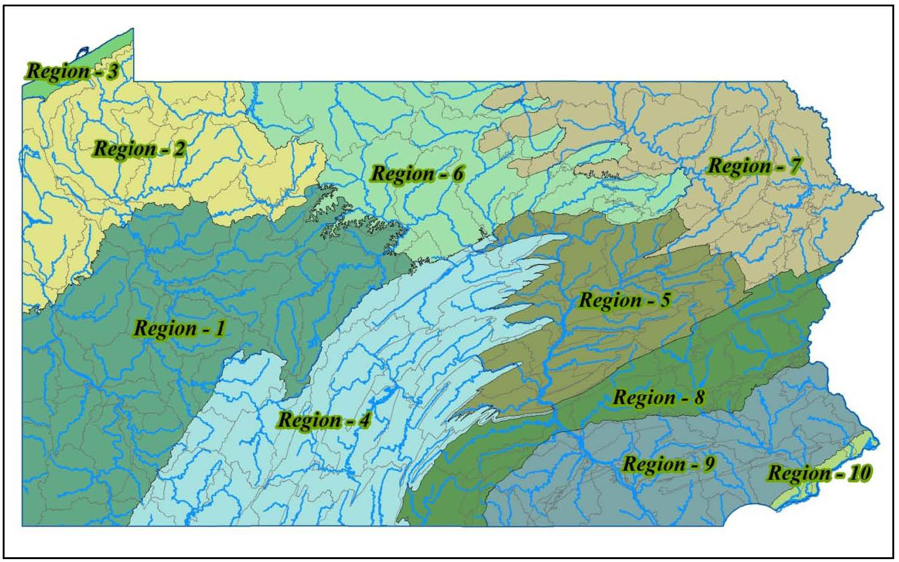
Pennsylvania was divided into 10 geographic regions for the purposes of developing models that responded to local conditions. Within each region, study areas based on watershed and topographic position were created totaling 132 study areas statewide.  For each study area, a customized predictive model was created.  As with most inductive predictive model development, known archaeological site data was used to build the models. Known archaeological site data was also used to test and further refine the models.  Environmental variables were used in the analysis, including distance to 3rdand 4thorder streams, distance to drainage head, nearness to wetlands, slope and average soil water capacity, amongst others. In this instance, the algorithms used were: backwards stepwise logistic regression, multivariate adaptive regression splines (MARS), and random forest (RF).

Geographic Regions used in the Model

The set of 132 archaeological predictive models created for this project (hereafter known as the Model) is one of the largest and most detailed ever published. The only other statewide model of this type is for Minnesota.  While Pennsylvania is half the size of Minnesota, the Model is at a finer grain (10m cells versus 30 m cells) resulting in roughly twice the number of cells in Pennsylvania than in Minnesota.   The Model is among the first published using both the MARS and RF algorithms in archaeology, and certainly the first on this scale.  The reports of how the Model was developed can be found in 7 volumes on PennDOT’s cultural resources page, the last volume (Number 7) being the synopsis of the study.

https://www.paprojectpath.org/docs/default-source/penndot-crm—general-documents/statewide-archaeological-predictive-model.pdf?sfvrsn=10

Example. Model Results.

Many Caveats

There are myriad issues associated with archaeological predictive models that I don’t want to get into now.  Some of these include:

  1. Inductive versus deductive-derived models. Deductive models have the greatest chance of having explanatory power, but the entire field is underdeveloped. Most predictive models in the US over the last 30 years have been inductive-derived.  Throw a passel of environmental variables into a regression blender and see what comes out.  PennDOT and PA SHPO went with inductive-derived models, sacrificing explanatory power for a better chance at finishing the project.
  2. Uneven survey across the state, both by setting and by region. Some locations are well surveyed (along rivers); some not so much (upper thirds of mountains and hills).  Clearly, regions with better data yield better results.
  3. Variable methods to identify archaeological sites, e.g. surface survey, shovel tests, reporting by avocationals, etc.  Of course you want apples to apples.  In the case of this study, the hope was that quantity (25,000 known sites) made up for variable quality.
  4. Lack of clarity as to what was actually surveyed, i.e., what patches of ground constituted surveyed versus non surveyed. The data set used to build the Model came from over 60 years of work.  This is not a trivial issue, as even site boundaries can be squishy, but this lack of precision was accepted into the study.

Again, each is worthy of its own discussion, but not today.  Instead, I would like to confront the issues of model testing and model validation. By model testing, I mean statistical testing.  By model validation, I mean acceptance and use in the archaeological community, i.e., a belief that the model is worth something.

Statistical Testing

Statistical model testing is predicated on the estimation of error in the model.  Often inductive models make it difficult to estimate error since there isn’t an independent data set available for testing purposes (Verhagen 2008).  A way to approach estimating error is through resampling and cross-validation techniques, such as bootstrapping techniques.  These were used in the development of the Pennsylvania Model.

For inductive models, we would want the model to be both accurate and precise, since the door to explanatory power is closed. A highly accurate model would identify all locations where there are archaeological sites.  A highly precise model would identify archaeological sites in the smallest area possible.  There are really no models that are perfectly accurate and precise.  The Kvamme gain measure combines accuracy and precision concepts into a single number.  In the case of the Pennsylvania Model, the overall Kvamme gain was 0.701. Comparable peer models analyzed by Harris et al had Kvamme gain values averaging 0.432.  So far, so good.

The Pennsylvania Model was operationalized into mapped sensitivity zones of high and moderate probabilities, and by inference low probabilities.  There is nothing inherent in the Model or in the Kvamme gain that specifies high, moderate, or low probabilities.  Nor, frankly are there any quantified definitions within their current use in Pennsylvania archaeology. Yet, this distinction has meaning in practice for compliance archaeology, and any model that would be used in compliance would necessarily need to make these distinctions.  In order to be able to map high, moderate, and low zones PennDOT and the PA SHPO had to make some subjective decisions.  Ultimately, the project team settled on a definition of Low probability of having less than 1/3 of predicted sites being located in more than 2/3 of the geographic area.  High probability was defined as having a prevalence of 0.1, or that predicted sites would be contained within 10% of the geographic area.  What was in between was classified as Moderate probability.

 “Testing” Work to Date

By setting metric standards for High, Moderate, and Low probabilities and by having a reasonable estimate of error, it became possible to compare two models, side-by-side and test whether one is significantly better than the other.  Given that inductive models are not explanatory, the only progress in model building would be this kind of side-by-side test.  Between 2014 and 2017, PennDOT interns worked closely with PA SHPO Staff to see how well the model was performing.  Results from compliance surveys reported after the completion of the model, i.e., independent data, were fair game (Conway et al 2018).  The preliminary results from this analysis supported the efficacy of the Model. It seemed to work.  A second focus of the study was in comparison of the different site discovery methods employed by archaeologists, basically the 3rdcaveat above. Unfortunately, no firm conclusions could be made due to the highly variable nature of testing methods and other idiosyncratic events that affected results.

Coming back to the premise of statistical testing, the question always comes back to tested against what?  The intern work was interesting and useful, but did not presume to be statistically rigorous.  For both the MnModel and the Pennsylvania Model, during model development, statistical comparisons were made against random calls, as a baseline.  Hopefully, any model would work better than coin flips, and in both cases, the models were statistically proven to do that with honors. For the next generation of models to be developed using fresh data, the new model can be measured side-by-side against the old model to see if it is better, not just by feel, but statistically better.  For now that test will need to wait.  To summarize, we have a Model that appears to be performing and works better than random calls, despite numerous caveats.

If You Build It, Will They Come?

The two questions of testing and validation: tested against what; and, will archaeologists use it? could potentially be resolved at the same time.  That the Model was tested against random calls is certainly a start, but the acid test would be against the pool of archaeologists currently making decisions on high, moderate, and low probabilities on their own. Essentially this would be comparing machine decisions against human decisions.  I believe the true test of any archaeological predictive model is whether it is significantly better than what we are doing today in the field on our own with our own puny little homo sapiens brains. Certainly, Alan Turing thought that this was the true test of machine intelligence, vis a vis the Imitation Game. Could an independent observer tell the difference between answers given by a human versus machine?

The utility of this approach is that it does not require the current Model to be perfect, only better than the current standard, which is best professional judgement.  If it can be demonstrated that the Model, or any of its 132 separate individual models is finding archaeological sites at a higher rate in a smaller survey footprint, then validation by the archaeological community will follow.

For us to get to the point where we could answer the Imitation Game question, two changes need to occur in the recording of archaeological surveys. First, all survey archaeologists would be required to state up front what precisely is their survey area, ideally tied into GPS coordinates. Within those survey areas, they would be required to divide the survey area into high, moderate, and low probabilities prior to survey and to report this information with the survey results. To the degree that survey methodologies would change within the survey area, they would also need to report this information also with polygons.  For example, if there is a plowed field within the survey area and it is covered by foot survey but the remainder of the survey area is shovel tested at 15m intervals, that would need to be reported.  Albeit this is a very fine grained reporting; however, we are at the point with technology that tablets in the field could record each and every shovel test pit or every minor polygon accurately and quickly.

Secondly, each survey archaeologist would be required to honestly assess probabilities prior to viewing the Model results, in order to make it a fair blind test.  Cheating is verboten.  This could be managed at the PA SHPO end by requiring each survey to submit its human generated predictions before gaining access to the Model generated predictions. Obviously, this would require some additional programming into the CRGIS and some additional permission steps, but it is doable.

Because the probability models are now artificially sliced up into 10m or 30m squares, but originally were continuous surfaces, it could be possible to customize the model expectations for each independent survey, using an algorithm similar to what was used to create the 10m or 30m probability squares in the first place.  All that is required is that the boundaries of the survey area be captured accurately and that a consistent algorithm be applied to slice that polygon into the high, moderate, and low probability polygons contained within the larger project area polygon.

One last intriguing possibility in organizing data in this way is to make the test less reliant on identifying archaeological sites and boundaries and instead looking at point specific (i.e., shovel test pit) results.  When considering shovel test pits, or 1×1 m units, the whole exercise becomes one of point sampling.  That location has a high, moderate, or low probability from the Model and from the archaeologist.  The result is either negative or positive (nominal data), or artifact counts (ratio), each with its own suite of statistical tools.  This test might do away with the concept of site entirely and focus on intensity of presence on the landscape, i.e., some spots are more intensively utilized than others.

Unfinished Business

Since the Model was introduced to the archaeological community in 2015, survey work has proceeded apace.  If the approach outlined above is to be pursued, then reporting methodologies and consistent human predictions of high, moderate, and low need to start yesterday.  It may be possible to data mine previous surveys through interview and reconstruction of notes, but that would be a labor intensive operation.

Changes to the CRGIS to produce customized probability zones based on revised algorithms would require some programming changes to the system that are not currently anticipated. In addition, survey data capture would also require programming changes in order to acquire that fine-grained data for analysis, and changes to permission rules to withhold Model predictions until human generated expectations are submitted.  As with any government-run system, a long lead time would be needed to effect those changes.

In the meantime, it would be prudent for either PennDOT or the PA SHPO to obtain the services of a statistician to help with research design for testing the model.  This would ensure that the data collection and analyses would pass scientific muster.

This is no small proposal, and would require adjustments in thinking and behavior within the archaeological community, not just adding some programming code.  I do believe that until these changes or something like them are instituted, we will not make progress on the original Model, and would risk the waste of all the good work to date that it has engendered.

Note:Because of my close involvement with the development and launch of the Model, I feel it is important to state that these comments are my own and do not reflect the views of FHWA, PennDOT, or the PA SHPO.

References

Conway, Jessica, Clare Farrow, and Haley Hoffman

2018       Testing the Pennsylvania Precontact Predictive Model.  Paper presented at the 83rdAnnual Society for American Archaeology Meetings, Washington, DC.

Harris, Matthew D., Robert G. Kinsley, and Andrew R. Sewell

2015       Archaeological Predictive Model Set. Final Report.Pennsylvania Department of Transportation, Contract 355101, Project 120205. Harrisburg.

Verhagen, Phillip

2008       Testing archaeological predictive models: a rough guide. In A. Poslunschny, K. Lambers, and I. Herzog (eds), Layers of Perception. Proceedings of the 35thInternational Conference on Computer Applications and Quantitative Methods in Archaeology (CAA), Berlin, Germany, April 2-6, 2007. Kolloquien zur Vorund Frhugeschichte,Vol. 10:285-291. Bonn.

Pennsylvania’s Commonwealth Archeologists Get the Short End of the Shovel

January 2019

Pay equity is a term that is bandied about in numerous discussions, often involving issues of race and gender.  However, you don’t have to go very far to find an example of pay inequity in the profession of archaeology.  Those archaeologists who are working as Historic Preservation Specialists are clearly not being compensated properly for the work they do, and it is well beyond time that the Commonwealth correct this.

What do Archaeologists Acting as Historic Preservation Specialists Do?

Archaeologists who work as Historic Preservation Specialists are employed in two Agencies, the Pennsylvania Historical and Museum Commission (PHMC) and the Pennsylvania Department of Transportation (PennDOT).  All told, there are about a dozen or so employees who fill these positions as archaeologists and another dozen who work as architectural historians.  The PennDOT archaeologists operate under a Programmatic Agreement with the Federal Highway Administration (FHWA) and the PHMC, which delegates a great deal of decision-making authority from FHWA regarding the implementation of Section 106 of the National Historic Preservation Act.  If this all sounds like federal regulatory language, it is. In plain English, these archaeologists determine what kind of archaeology is done on PennDOT projects, review reports, decide which archaeological sites are important, and coordinates with all stakeholders interested in the archaeology on a project. They have a lot of latitude on those decisions and operate largely independently from Central Office Management, as they are also based in District Engineering Offices scattered around the Commonwealth.  (Despite this autonomy, there are numerous and effective safeguards to prevent the archaeological equivalent of Dr. Strangelove.)

The PHMC archaeologists are on the other side of the table in the conduct of this archaeology, as well as the conduct of all archaeology done in the State under Section 106. They also advise state agencies on the need to conduct studies under the State History Code.  Although the PHMC archaeologists operate in the same office under the same roof, they also have a lot of latitude on those decisions.  Both the PHMC and PennDOT Historic Preservation Specialist positions are highly technical and highly specialized, and for which expertise is the reward for extensive experience and knowledge. These men and women don’t learn their craft in a day, a month, or even in several years.

What Does it Take to Make a Professional Archaeologist?

There is some difference of opinion within the profession as to what makes a good archaeologist, and some difference even as to whether archaeology is a profession, a trade, a practice, or something else entirely.  What everyone does agree upon is that archaeologists are not made quickly and that years of experience are worth something in the form of expertise. There is no national licensing of archaeologists and no licensing within Pennsylvania. The closest anyone has to a national Standard is either the Registry of Professional Archaeologists (RPA), or the National Park Service’s Secretary of Interior (SOI) Standards. RPA registry is more of a good practice instrument than a qualifications instrument, and doesn’t align 100% with the SOI Standards. 

The Secretary of Interior Standards for a Professional Archaeologist is below:

The following requirements are those used by the National Park Service, and have been previously published in the Code of Federal Regulations, 36 CFR Part 61. The qualifications define minimum education and experience required to perform identification, evaluation, registration, and treatment activities. In some cases, additional areas or levels of expertise may be needed, depending on the complexity of the task and the nature of the historic properties involved. In the following definitions, a year of full-time professional experience need not consist of a continuous year of full-time work but may be made up of discontinuous periods of full-time or part-time work adding up to the equivalent of a year of full-time experience. 

The minimum professional qualifications in archeology are a graduate degree in archeology, anthropology, or closely related field plus:

1. At least one year of full-time professional experience or equivalent specialized training in archeological research, administration or management; 

2. At least four months of supervised field and analytic experience in general North American archeology, and 

3. Demonstrated ability to carry research to completion. 

In addition to these minimum qualifications, a professional in prehistoric archeology shall have at least one year of full-time professional experience at a supervisory level in the study of archeological resources of the prehistoric period. A professional in historic archeology shall have at least one year of full-time professional experience at a supervisory level in the study of archeological resources of the historic period.

It’s a lot, isn’t it? If you sit down with a calculator, even by doubling up on item 1 and 2, you still end up with the requirements of a graduate degree, plus an absolute minimum of 2 years of specialized experience. Coming out of college, a prospective professional archaeologists is looking at a 4 year commitment till they get their credentials.  This is longer than it takes to become a lawyer, the same amount of time to become a veterinarian or professional engineer.

Why is the Secretary of Interior Standard Important?

The SOI Standard is what the National Park Service uses to establish what is qualified staff at the State Historic Preservation Office.  By regulation (36 CFR 61.4.e), every SHPO staff must include at least one member who meets SOI Standards for Professional Archaeologist.  Failure to do so can lead to action by NPS against the SHPO.  At PennDOT, each archaeologist acting as a Historic Preservation Specialist under their Programmatic Agreement must also meet these same SOI Standards.  By meeting SOI Standards, PennDOT demonstrates that its staff has the knowledge and expertise to make findings of eligibility and effect on behalf of FHWA and can properly work with the SHPO and other parties to resolve issues related to archaeological resources found on PennDOT projects.  The Standards are so important that it would be safe to say not only would the current Programmatic Agreement be terminated, but there would be no other Programmatic Agreement without PennDOT staff meeting the Standards.

The State Employment Classification System

All state employees are classified according to a predetermined system.  Each classification sets a pay range; a definition of the position; examples of work; required knowledge, skills, and abilities; and, minimum experience and training.  Historic Preservation is in a progressive classification series, containing Historic Preservation Specialist (Pay Range 7), Historic Preservation Supervisor (Pay Range 8), and Historic Preservation Manager (Pay Range 9).  Each bump in pay range amounts to about an 8% increment.  Understanding that at least one archaeologist at the SHPO must meet the SOI Standards and that all of the PennDOT archaeologists must meet the same Standards, how does the minimum experience and training for the Series stack up against the Standards?

RequirementSOI StandardsHistoric Preservation Specialist Job Classification
Is any knowledge of archaeology required?YesNo
Is an advanced degree required?YesNo
Professional experience or equivalent specialized training in archeological research, administration or management1 yearNone
Supervised field and analytic experience in general North American archeology4 monthsNone
Is there a demonstrated ability to carry research to completion?YesNo
Professional experience at a supervisory level in the study of archeological resources1 year (full-time)None

Particularly troubling is the fact that the Historic Preservation Specialist Classification was designed for an architectural historian or historian and makes no reference to archaeology at all.  The Historic Preservation Supervisor Job Classification also has none of the SOI Standards in its requirements. The Historic Preservation Manager is the lowest classification that requires an advanced degree.

PennDOT Historic Preservation Specialists necessarily work with a great deal of independence and have authority to sign off on findings of eligibility and effect on behalf of the FHWA. As part of the definition of work for the Historic Preservation Specialist:

Work is performed under the directionof the Historic Preservation Supervisor. Work is reviewed while in progress and upon completionfor compliance with procedures, regulations, policies and results. (my emphasis)

To summarize:

  • Neither the Specialist nor Supervisor Classification require the advance degree that the SOI Standard requires.
  • None of the Classifications in the Historic Preservation Specialist Series have the experience requirements of the Programmatic Agreement or Federal Regulation to employ a professional archaeologist.
  • On paper, the SOI Standards require two more years of education and/or experience beyond that which is required for the Historic Preservation Specialist.
  • Historic Preservation Specialists employed by PennDOT exercise a qualitatively greater degree of independence than what is defined in the Classification.

Oh, by the way.  The Historic Preservation Specialist Classification was created in 1986, over 30 years ago.  It is certainly due for a review, regardless of the number of state employees it covers. 

Is there a better series under which to hire professional archaeologists? The Museum Curator, Archaeology 2 Classification does reference archaeology and does require an advanced degree:

One year of curatorial work in the field of archeology, and a master’s degree in Archeology or Anthropology, including or supplemented by either a museum studies course at the graduate level recognized by the American Association of Museums or a museum internship

However, the job experience must be in the field of museum work, and the description of work is entirely curatorial.  Neither the SHPO nor PennDOT have museums nor the need for curators.

Conclusions

Archaeologists employed as Historic Preservation Specialists at PennDOT require significantly more education and experience than the Classification requires, have greater responsibilities and act with greater independence than the Classification describes, and require specialized knowledge in archaeology that the Classification ignores. The archaeologists employed at the SHPO could be exercising the same degree of independence and follow the regulatory requirements on staff qualifications. This would allow SHPO archaeologists to be free of confinement to a central office, and be located in different parts of the state, closer to their projects. The only reasonable conclusion that can be drawn is that all of the archaeologists employed in the Commonwealth as Historic Preservation Specialists are mis-classified with no suitable substitute and are also underpaid for the work that they do.  And they are long overdue for redress.

Solutions

One could simply say that we are in a free market and that people take jobs voluntarily, including jobs that pay less.  I think this misses the point.  The Commonwealth Classification system is after all, a system and that it should maintain some internal logic.  One aspect of that logic is to expect that jobs with comparable educational and training requirements at comparable responsibilities should command comparable wages.  Isn’t that what pay equity is about?

FHWA and PennDOT might assume that regardless of the wages being paid and benefits being slashed in an open market, there will be an endless supply of qualified candidates to fill vacancies.  That is a shaky assumption.  As having had the privilege of hiring about a dozen archaeologists over the years, I do believe that PennDOT and the Commonwealth is reaching the point where the pipeline of highly qualified archaeologists will dry up.  This may not happen overnight, but inevitably the managers at PennDOT will be faced with longer vacancies, a more poorly qualified candidate pool, and some risk that the Programmatic Agreement that confers so much efficiency on Department projects will be terminated, if not by lack of staff then by implementation of the Agreement by inept and unqualified employees.  Prospects for the SHPO are to have less qualified staff making more rigid and formulaic recommendations at an ever slowing pace.  The Section 106 process will slow down.

The short term solution could be to give every Historic Preservation Specialist a 3-step bump, which is equivalent to the 8% differential between classification, and to start all future staff at Step 4 instead of Base salary.  This is suggested only as a band-aid until the root cause of the pay inequity can be addressed – the substantial revision of the Historic Preservation Series.  One important revision that should be considered is the creation of a new Classification, being the Historic Preservation Professional Archaeologist which would align minimum education and training requirements with the SOI Standards, and would update the Definition and examples of work to conform to the cultural resource management duties undertaken by most staff.  It would be reasonable to peg the Historic Preservation Professional classification at a Pay Range 8, bringing it in line with other specialized jobs that require extensive education and training.

This is my blog and my space and my rules, but you may well ask to whom is this particular blog addressed?  I don’t count any employees at the Office of Administration as followers of this site, and these are the people that need to read this, especially the upper management. I am aiming my words at the archaeological community in hopes they will contact the Governor and the Office of Administration to push for this change.  Having Commonwealth archaeologists who know what they’re doing and operating with some level of job satisfaction and presumably job stability can only benefit the entire archaeological practice in the Commonwealth.

The Economics of Solar Panels (in Central PA)

December 2018

Going with a solar installation is no minor investment. If you are considering solar, look at your annual consumption of electricity, in kilowatt hours (kWh). The generic prices for installation is around $3 per kWh.  That will put you in the ball park.  Our annual electric usage is 7,500 kWh.  Making a decision on whether to go solar or not takes in a lot of factors and it is no simple calculation.  And this disregards any important considerations of saving the planet.

First, a word about scalability.  Our system is on the smaller side, at 7,500 kWh/yr.  There is a bit of an economy of scale, so larger systems would be less expensive per kWh.  This is intuitive as the increase in the system will be through the addition of solar panels only.  For an average homeowner, the wiring into the electrical box, permits, inverter all would be the same regardless of the size of the system.  So the installation of 27 panels would not be half again as much as the installation of 18 panels.

Federal Tax Credit

The gross installation price is usually not the actual cost of installation.  Our Federal government provides a 30% tax credit for solar installations.  If you pay Federal taxes, this is a straight deduction against your tax bill, so if your taxes owed is $100, and your installation is $50, you would get a $15 deduction against your taxes, so now you would only owe $85.  Effectively, those $15 goes into your pocket, or if you wish, you can treat this as a 30% discount against the gross installation cost.  This tax credit is available whether you itemize or not.  Using our $3 per kWh figure from above as your gross installation price, the net installation price is reduced to $2.10 per kWh.  The tax credit is found through Residential Energy Credits at Form and Instructions for 5695.

SRECs

There is something called a Solar Renewable Energy Certificate (SREC).  These exist because of a federal regulation that establishes a renewable portfolio standard (RPS), which requires the increased production of renewable energy sources, such as wind, solar, biomass, and geothermal.  Energy providers in different states have different RPSs.  Power companies can build renewable power plants. but they can also buy credits from individuals or companies that generate renewable energy.  They are traded on an open commodity-like market. One credit is created from each 1,000 kWh of electricity produced. Our system should generate 7 credits each year. Because the mandate differs from state to state, the credits are worth more in some states than others.  For states that have a high mandate, the credits are worth a lot and genuinely subsidize the cost of the system.  In other states, such as Pennsylvania, where the RPS is lower, the value of the SRECs on the Pennsylvania market is correspondingly lower, currently in the $10-15 per credit range.  While there was a recent law (Act 40) to ban the sale of credits into Pennsylvania from out-of-state, this is still a squishy area.  For purposes of our calculations, we see only a $80-100 per year additional benefit from SRECs here.

            Solar as Investment

During our lives, we all make some major purchases: a car, a college education, a house, a wedding, a new roof, etc.  How we see these purchases differs, depending on not just the cost but on whether it is treated as an investment or not.  An investments can be thought of as deferred return for the money spent.  Perhaps the ultimate investment might be a retirement plan, where we don’t expect to see a payoff for 30 years.

How then to see a solar installation?  Leaving aside any warm and fuzzies about the planet, how does it make sense financially?  In our case, we plunked down a chunk of cash. What do we have for our purchase, even if subsidized by the Federal government?  For starters, we are talking about electricity generation. Each year, we normally consume around 7,500 kWh of electricity.  We are averaging about $90 a month for our electric bills (for charges above the basic customer charge by PPL), or $1,100 a year.  We anticipate using electricity for the rest of our lives, so this is going to be an annual cost for the rest of our lives. Our return on investment of the installation of a solar panel system would be $1,100 per year.  So the question now becomes how many years of electricity production does it take to amortize the cost of installation, also known as the Solar Panel Payback Period.  If you go on the internet, you will see numbers ranging from 4 to 15 years. This is due to different reasons.  In different parts of the country, the effective hours of sunlight will differ, figured in kWh/m2per day. Some parts of the country generate twice as much electricity per panel per day than others.  Pennsylvania is on the lower end of that spectrum. Secondly, some states offer additional incentives to go solar.  Pennsylvania does not.  In some states, the RPS is more stringent. In Pennsylvania it is not, calling for only 9% renewable energy by 2038, so the SRECs are worth less.  

To summarize, going solar here is like fighting with one arm tied behind your back – less sunny, lower RPS and consequent lower SRECs.  This would push us to the longer end of the Payback Period Spectrum.  Still, we think for us this Payback Period will be 13 years.  What this means is after 13 years, the system is paid for and will be generating electricity for free, electricity we would still be paying for.  The warranty on the system is for 25 years, but there’s an expectation that it should last longer.  Realistically, we think we could be here for another 20 years, so let’s use that for the time frame.  If electric prices do not rise (and they will), this means we will have made around $10,000 during that period. Comparing investments, if we had put the entire payment into a CD paying 3%, after taxes it would have been a wash. Now, 3% is not spectacular, but I have been conservative on all of the estimates so far, assuming current SREC and electric rates that do not increase.

House Resale

Does the installation of a solar system increase the resale value of the house? Definitely.  The rule of thumb is $3 per kWh, meaning the added resale value to the house would be around $22,000.  Clearly, the new owners would have the generating value of the system for their electric needs. How long a solar system could last is unclear. Data shows that the panels do slowly degrade over time, generating less electricity.  The 25 year warranty is generally for 80% of the original capacity, meaning that after 25 years, the panels are warranted to generate at least 80% of the original production.  Well-made panels should last longer, so that the 80% threshold should not be reached for 30+ years. 

Financing

We also chose to finance the system by writing a check, a luxury we had due to a sick leave payout when I retired.  A lot of folks simply don’t have the necessary Simoleans handy, so other means of financing would be considered.  For starters, this project would qualify for a home equity loan.  Currently, if you are itemizing (big if), you can still deduct the interest paid on a home equity loan to install a solar system.  There are other cost-free schemes out there, such as Solar Purchase Power Agreements.  A PPA means your solar company owns the panels on your roof, and you pay for the electricity they produce, at a discount. Anything that would not call for you to pay out of pocket also would not be as remunerative.   Whether you would buy outright, finance, or enter into an agreement, I believe that even here in suburban Pennsyltucky, the economics can work.

Fiscal Bottom Line

If the only consideration we had was fiscal, then installation of solar panels at our home made sense.  Not only does it give a return of 3% over 20 years, but adds to the resale value of the house.  The installation also functions in the same way that a fixed mortgage works. We have a known and fixed cost of electricity for pretty much as long as we live here.

Solar Basics

December 2018

The basic technology and economics of solar PV panels has been worked out and other than a brief overview, I would point you to the Internet for as much detail as you would like.  First, solar comes in two flavors, one of which is the PV collector system we got.  The other is a solar water heater, which uses the sun to concentrate heat on tubes that produces hot water for home use.  Within the solar PV universe, there are again two choices: on the grid or off the grid. Most people probably think of the off-grid option when the words “solar panels” are spoken.  Off-grid means that the solar panel system is self-contained and the home would not be connected to any external electrical service.  No solar system will generate electricity at night (remember the joke about the solar powered flashlight?). For an off-grid system to work, it must be paired with a battery backup and be robust enough to generate enough electricity during the maximum months of usage (for us in the summer).  Off-grid systems make sense in remote areas with sketchy electrical service.  But we are in suburbia and with a generally reliable system (thank you, PP&L).  We have perhaps 1-2 outages a year, which rarely last longer than 4 hours. For us, an integrated on-grid system makes more sense.

Solar Panels stacked and ready to go, worth their weight in brisket.

Solar generation is the same on- or off-grid, the sun hitting PV collector panels and making DC electricity. From there, each panel has a power optimizer attached to it that independently maximize the power produced and coordinates with the other panels to keep voltage constant and maximize power production.  The electricity is merged into a single line that goes into an inverter.  The inverter changes the DC electricity to AC.  If you have rechargeable batteries in any form – think power tools or cellphone –  you have inverters.  This inverter does a bit more, since it also gathers and transmits data regarding the real-time operation of the system and can link to a computer.  From the inverter, the AC electricity feeds into an independent meter that tracks generation and then into the service box.  The service box is still connected to the meter outside the house. When we use less electricity than we are generating, we are energy producers and the outside meter runs backwards. When we use more electricity than we are generating we are energy consumers and the meter runs forward. Once a year, there is an accounting of the net usage.  So some months we are going to be to the good, and some months we will be drawing on that surplus

Inverter and meter, installed in basement.

As a matter of estimation, we calculated enough panels to produce 95% of the electricity we use each year.  In Pennsylvania, PP&L will buy our excess if we were to use less than we produce, but the rate is not ideal as it does not include distribution costs.  Generally, the perfect situation is produce 1 watt/hour less per year than we would use.  We have 18 panels in a 6×3 array, that is anticipated to produce 7,500 kWh per year, close to our annual consumption.

Other Considerations

As noted above, if your energy needs are greater than ours, solar may make even more sense.  We don’t heat with electric, but some do.  We do not have an electric water heater, but some do.  

Even with the constraints of being at this latitude in Pennsylvania, there are clearly better and worse spots.  Ours is nearly ideal with a south-facing and unobstructed roof that is far enough away from large trees and large enough to hold an adequate array.  The pitch of the roof also makes a difference.  Ideally, a fixed, roof-mounted solar energy system should be at an angle that is equal to the latitude of the location where it is installed. Our latitude here in New Cumberland is 40 degrees.  Our roof pitch is much less – 23 degrees.  The recommended range of pitch is 30-45 degrees.  We are probably giving back some watts, but that is the pitch we have to work with.  If your pitch is closer to 40 degrees, you have closer to the ideal pitch for this area.

Solar Panels: Our Story

December 2018

Mr. and Ms. Green Jeans

As a background to this story, I’d like to share our energy and consumption habits.  We have tried over the years to hold and maintain a green energy ethic, including conservation, re-use, and recycling.  We converted our old boiler from fuel oil to the highest efficiency natural gas boiler we could find ten years ago.  Our hot water is on demand.  When we buy a fridge, or dishwasher, or washing machine, we always look for the most energy efficient.  We’ve swapped out light bulbs for LED’s or CFL’s wherever possible.  We garden and we compost.  We cook from scratch a lot and stay away from pre-packaged foods, when we can.  We take our bags when we go grocery shopping, and refuse plastic bags whenever possible. We save and re-use when we can’t. We bundle our newspaper and fill the recycling bin.  We bought our house big enough to raise our family, but no bigger.  When I was working, I either bicycled to work or took the bus, keeping my driving in to less than a dozen times a year.  Our strategy is to buy quality new and then wear it out over a longer period of time before replacing.  If it can be repaired, we generally will fix it before replacing it.  (Other than books) we have shied away from owning things, especially now that the kids are out of the house.  

And in raising a family and living our lives, we have made knowing compromises with the environment.  The natural gas that warms our house and cooks our food is still a fossil fuel, and while cleaner than coal or fuel oil, is not ideal.  We have and use central air conditioning, increasingly so in recent years.  Either it has been warmer or we are older, or both, and no we are not getting rid of it. We still have two cars, and although one is a Prius, the other car is an small land yacht that gets 18 mpg (we try not to drive that one when we can).  I have a gas-powered lawnmower. We eat meat.   We fly across country to visit family, our contrails scratching across the sky.

Why Solar Now?

I would like to say that our decision to install solar photovoltaic panels came from a galvanizing moment, but in fact resulted from the convergence of a several seemingly non-related events.  In no order of importance, the first was probably my retirement from State Service.  For those of you who haven’t retired from the Commonwealth, there is a nice little cherry on top besides getting the sought-after pension.  If you have been reasonably healthy and have worked a reasonable number of years, you accumulate a healthy reserve of sick leave. At retirement, the Commonwealth will buy it from you at a set formula, which could result in your getting the equivalent of up to a dozen extra paychecks, all at once (closer to 7 in my case).  If you have any unused annual leave, that is thrown in on top.  So even after taxes, you find yourself looking at a last pay statement that could indulge most of your most modest fantasies.

The second event was our trip to Scotland, a week after I retired.  Now, almost nothing from the trip is relevant to this story.  It was a wonderful and exciting journey through the Highlands, worthy in its own right.  However, we did notice a proliferation of large wind mills and wind farms throughout the Highlands, as well as more than an occasional solar panel.  This in a country more noted for foggy moors than tropical sun.  It turns out that Scotland, the entire country, has set a goal of 100% renewables for electric energy by 2020, and 11% of all heat demand by the same year. Renewables in Scotland include wind (onshore and offshore), hydro, wave, tidal, biomass, solar, and geothermal.  Being Scots, yes, they are on target to meet those goals.  Now Scotland has a wee more than 5 million people, with 20% in rural areas, so it is not that large a country.  The United States has 22 states with more people than Scotland.  States close to Scotland in population include: Alabama, South Carolina, Minnesota, Colorado, and Wisconsin.  So you could visualize the equivalent of Scotland in several places in the US.  But in no state are renewable targets like Scotland’s being set and made.  The closest is Hawaii, with a target of 100% renewable but by 2045.  Scotland is a western, industrialized country. Hell, they invented industrialization. We are a western, industrialized country.  We’ve even acquired a lot of Scots through immigration.  But outside of a few pockets in California, Arizona, Texas, and the Southwest, there is not this level of commitment to renewables. Scotland is making it work, and they are not idiots, and (as Scots would have it) they are making it pay off.

The third event was the release of several world climate reports this Fall, beginning with the UN Intergovernmental Panel on Climate Change Report, released October 8th, followed by the Fourth National Climate Assessment (November 23rd), and the NOAA Report Card on the Arctic (December 3rd).  The tie between human-induced emissions of COinto the atmosphere and accelerating climate change was presented at Toronto 30 years ago with a call for world action.  Collectively, these 2018 reports reaffirm the science behind climate change and demonstrate that the original projections for the world heating up were in fact too conservative and that the rate of change is faster than we thought.  The bottom line is that unless we as a world society make substantial changes in the emissions of CO2over the next 12 years– emissions caused by the burning of fossil fuels – our children will face a substantially hotter planet and everything that comes with it.  The call for action is now.

There was one other reason to fan the urgency for action. Currently, the Federal Government gives a 30% tax credit for installation of solar panels.  If you have an annual Federal tax bill, this is real money. The credits were due to expire in 2016, but were extended through legislation.  The December 2015 tax bill extended the credits through 2021, but the full 30% credit is only good through 2019.  As we have seen with this Federal Administration, there is an open hostility toward renewables, shared by many republicans in Congress.  Prior to the November 2018 election, there was a palpable chance that the credits could go away entirely in early 2019.  The clear message was that it was the time to act.

The elements for the decision to install solar PV panels were in place:  a predilection toward green energy, an urgency, a vision of someone actually doing this (the Scots), and enough funds to pay for it.  If there was anything resembling a triggering event, it was a domestic disagreement over the second car, a a big lumbering beast that gets terrible fuel economy (18 mpg). Nicknamed “the Couch” for its ride, both of us hate the car and hate driving it.  The saving graces were that it is paid for, mechanically sound, and is only used as a backup vehicle.  Both of us wanted to replace it, but we could not agree with what.  Linda wanted another Prius, which we both like and appreciate.  I wanted either to get rid of the second car entirely and go down to one car (probably not practical at our point in our lives), or to get an electric car like a Bolt or Leaf and make the electric our primary local car, saving the Prius for trips. Because we could not come to an agreement, and status quo could work, we dropped the idea for a change in cars. Instead, we took part of the payout to reduce the mortgage on the house and started our research into solar PV (photovoltaic) panels.

The Green Payoff

Solar PV systems can work financially, even in a place like Central Pennsylvania (see my post on Solar Economics).  However, to be clear, economics was not the primary driver for our decision.  We made our decision more for other reasons, but didn’t want to take a bath on the costs.

The recent news on greenhouse gases, especially CO2, is uniformly scary.  If we do not act now as a society, we (by we, I mean our children and our grandchildren) face a greatly warmed and destabilized planet.  Yesterday, I heard a vivid analogy.  Our house is on fire and our children and grandchildren are in the attic. How do we get them out?  I’m not saying that installing solar panels will save the planet, or cure cancer, or whatever. But I think this it is a meaningful act.  Here is what we are facing.  We are dumping carbon, in the form of CO2, into the environment at unprecedented rates. In order to keep world temperatures from rising more than 1.5 degree centigrade (2.7 degrees Fahrenheit) from pre-industrial levels, we need to halve greenhouse gas emissions by 2030 (in 12 years) and reduce greenhouse gas emissions to zero by 2050. This is what the Paris Climate Accords called for.  Even with only a 1.5 degree increase, we would face stronger storms, more erratic weather, dangerous heat waves, rising seas, and largescale disruption to infrastructure and migration patterns.  Past 1.5 degrees, we will see hotter summers, larger and more severe storms, longer droughts in areas, rising sea levels and an acceleration in rising sea levels, decrease in agricultural productivity, and a destabilized environment in places where there is currently political and economic unrest. Just look at Syria, for example.

Is our conversion to solar going to halt all this? Nope.  In the United States alone, in 2017, the electric power sector put 1,744 million metric tons of CO2 into the environment.  The current population of the US is 325 million residents, so each man, woman, and child is responsible for 5.37 metric tons of CO2each year, just from electric production.  Our modest 7,500 kWh of annual electric generation saves somewhere between 3.1 and 7.3 metric tons of CO2each year, about what one person would generate based on a national average.  Removing this CO2from the environment reduces US  greenhouse gas emissions from electric generation by 0.000000308 percent.  Whoopee!

Still, each of us has a responsibility to be good citizens, not just of the United States, but of the world.  And to quote Margaret Mead:

Never doubt that a small group of thoughtful, committed citizens can change the world; indeed, it’s the only thing that ever has.

We want our action to be a call for action.  Conveniently we are just across from the New Cumberland Library.  Maybe seeing solar panels by patrons of the library will start a conversation.  We are trying to start a conversation by merely posting this blog.  We want everyone to go solar, as long as they can manage it.  Ask us how.  We want and need everyone to start thinking about energy conservation and how to reduce each person’s carbon footprint. And we need everyone to press their legislators on ways to support carbon emission reduction through public policy.  Upping renewable targets would be a start.  A carbon tax would be another.  Exempting solar installations from income tax and property taxes would be a good thing.  The Commonwealth should restart and fund the Pennsylvania Sunshine Solar Program, which ended in 2013. 

A rapidly warming planet is no boutique issue. Remember, the attic is on fire and our children and grandchildren are trapped in there.