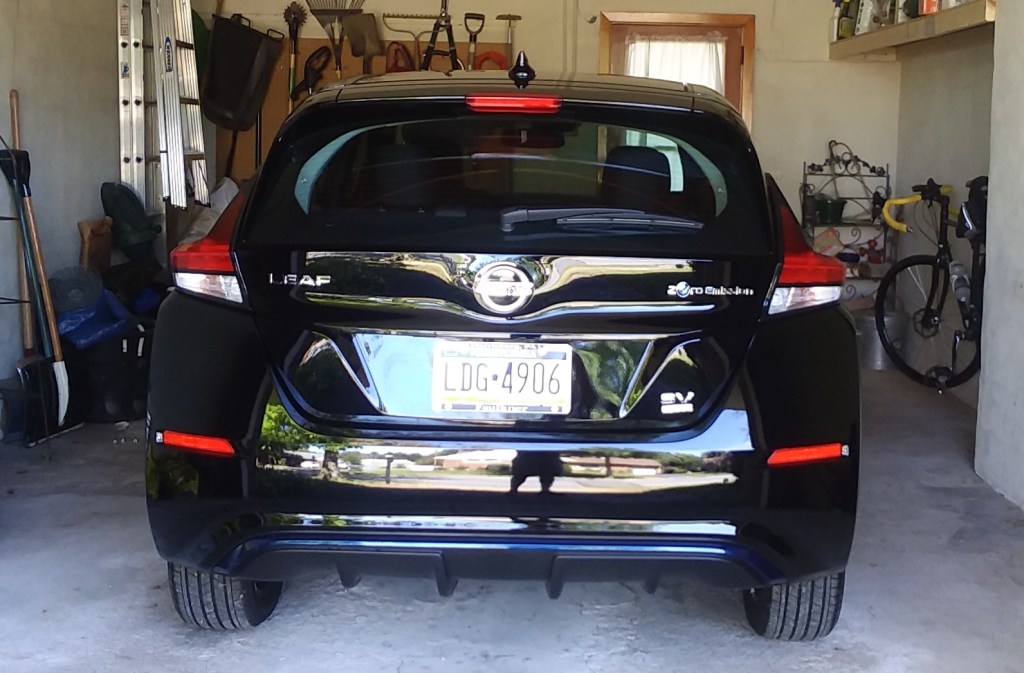
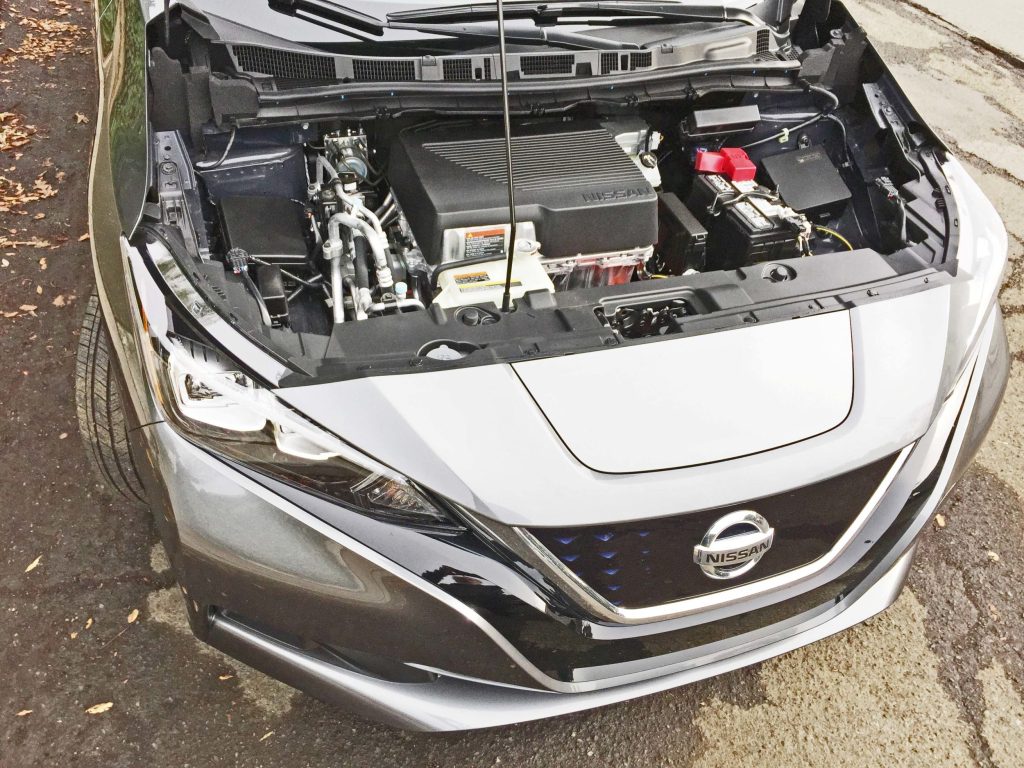
On September 16, 2019, Linda and I bought our first all-electric car, a 2019 Nissan Leaf. How we came to buy an electric car was the result of a the convergence of several events. First, we had reached the emotional limit on the 2008 Buick Lacrosse we had acquired from Linda’s mom, a big lumbering couch that got 18 miles per gallon. It ran and we owned it clear, but that was about all you could say about it. Secondly, we had someone inquire about the car/couch, someone who wanted that basic transportation. It got us thinking about what would replace it. We have a 2015 Prius with about 60000 miles on it. Our strategy for the last 20 years has been to have one newer car and one older car, rotating out the older one after driving it into the ground (figuratively, please!).
We had a long discussion as to whether we could actually manage on one car only, which would be cheaper if somewhat inconvenient. We are both busy in our retirements and have enough appointments independent from one another as to make a single vehicle household impractical. So a second car was going to be in our lives for a while. But an electric?
Why Should We Care?
We have been mindful of what is happening around us in the world. The Environment Section of the Blog is a result of that mindfulness. If we are going to be better than OK Boomers, we need to continue to reduce our carbon footprint. Last year, we put up solar panels, a start. The next step seemed to be getting an electric vehicle, an EV.
On moral grounds, decarbonizing where we can seems compelling. The average automobile uses something like 650 gallons of gasoline a year. [The number is squishy, because no one really tracks it. We don’t track average mpg for all cars, only new cars. We count total gallons used nationally, but not for the individual car. So any rough number will do.] We do know that each gallon yields 19.64 pounds of CO2 into the atmosphere. So, roughly each gasoline powered car pushes a bit over 6 (2,000 pound) tons of CO2 into the air each year. For comparison, 6 tons is slightly less CO2 than Pennsylvania produces every second of every minute of every day in a year. While you might think that this means cars don’t produce much CO2, keep in mind that there are over 8 million passenger cars on the road in Pennsylvania, so the automotive car sector contributes 20% of all CO2 produced each year, which is not insignificant. One car barely qualifies as a flea bite, but a swarm of cars can affect our climate.
The economics behind electric cars don’t seem to be in our favor. Gasoline is $2.70 a gallon, the lowest it’s been in 20 years. The Administration is pushing coal, and is fighting CAFE standards. Americans bought 43 pickup trucks for every electric car bought last year. Toyota sold more RAV4 SUV’s by March 10th than all of the electric cars of all models sold last year. Registered electric cars in Pennsylvania topped 7,600 last year, all of 0.09% of registered cars statewide. In Cumberland County, we were likely the 120th registered electric car. What is wrong with this picture?
The Case for Electric Cars
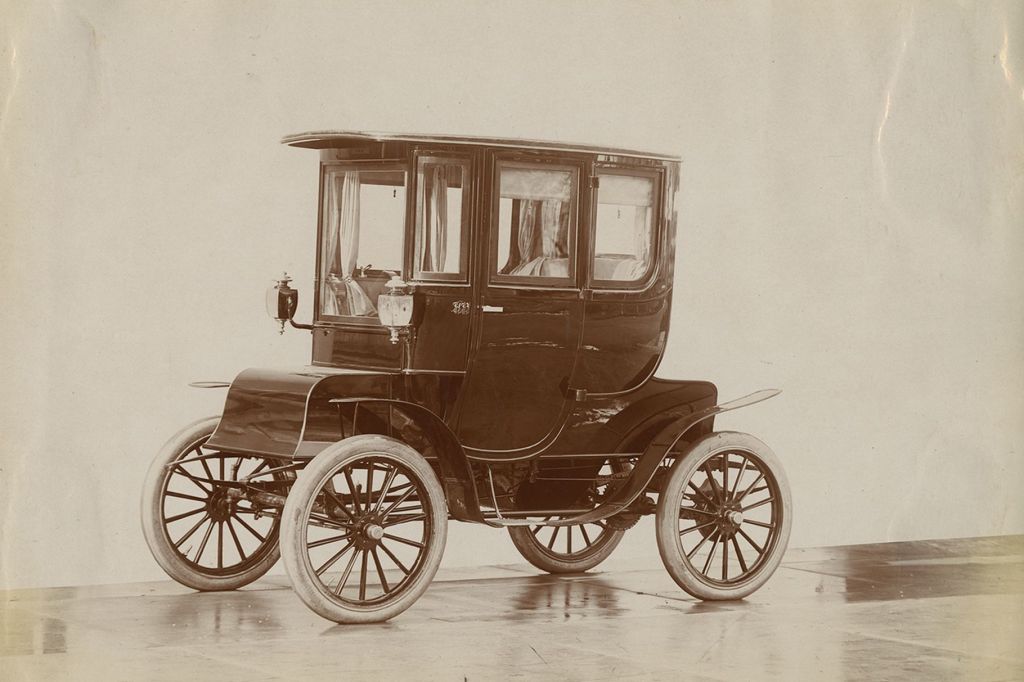
Electric cars have been among us for over 100 years. In urban areas, they preceded gasoline powered vehicles. In 1900, 38 percent of cars were electric powered, with 22 percent powered by gasoline. The remainder were steam powered. Today, the technology for EVs is reasonably mature. Practical electric cars, relying on lithium-ion batteries, have been on the road for around 10 years, beginning with the Tesla Roadster in 2008. The issue with range is being addressed stepwise, so that now there are several choices for cars that get more than 200 miles on a charge. Infrastructure is being developed nationwide, but unevenly, so that it is possible to see a day in the not too distant future where effective and quick chargers will be no more than 40 miles from anywhere. And finally, electric cars do not emit CO2.
Cost has also dropped, largely due to the cost of manufacturing the batteries. Both the entry level Chevy Bolt and Nissan Leaf Plus have MSRP’s under $37,000 (before any credits or rebates). [See Ford Vs Ferrari?… for a side-by-side comparison of Leaf Vs Bolt.] The cost of ownership is also greatly influenced by Federal and state credits and rebates. The tax credit landscape is uneven, as some cars have reached the 200,000 car limit for full rebates. As of this writing, The Tesla rebate for the Model 3 has expired. The Chevy Bolt has a $1,875 Credit until March 31, 2020. The Nissan Leaf has a $7,500 Credit that is not set to expire in the near future. In addition to the Federal Tax Credits, Pennsylvania is offering a $1,500 rebate at least through December 31, 2019.
Caveats
To be clear, owning an electric car isn’t for everyone, at least not yet. Range is an issue, but not insurmountable. Few EVs have a range comparable to a gas-powered vehicle, which is usually over 300 miles. More importantly, using an EV for travel depends on the presence and abundance of EV charging stations. Charging stations come in two main types – Level 2 and Level 3. Level 2 chargers run at 240 Volts and most vehicles can use them interchangeably. However, it takes approximately 8-12 hours to fully charge a vehicle that has a 200+ mile range. For a road trip, that’s a show stopper, unless your one-way trip distance is within that 200 mile range. Level 3 chargers generally can put 80% of the electricity bank into the “tank” in 30-45 minutes. This translates to stops every 3 hours to take a break and recharge. Which is not bad for most drivers, who should take breaks every couple of hours of driving.
These Level 3 Chargers run at 480 Volts and in Pennsylvania are not everywhere common. For example, on the Pennsylvania Turnpike, there are exactly 5 stops with ESVE stations: Oakmont Plum, New Stanton, Bowmansville, Peter J. Camiel, and King of Prussia Service Plaza. From Harrisburg travelling west, the first and only charging station is 170 miles away. Travelling east on the Turnpike, the distance between Oakmont and the next charging station (Bowmansdale) is 240 miles, beyond the range of most EVs. As one might expect, the bulk of the Level 3 stations are in and near Pittsburgh and Philadelphia. Outside of these urban areas, you need to know and memorize the locations of Level 3 stations to plan a trip. Fortunately, or unfortunately, you don’t need to memorize a long list.
Driving habits also can and should play into the decision to own an EV. If you are primarily using a car to run errands and get around locally, an EV can definitely fit. We have the luxury of owning 2 cars – one for local driving (the Leaf) and one for trips (the Prius). We also have the luxury of a garage and owning our own house. So we have installed a Level 2 charger in our garage, for around $1,200 including wiring. Currently, we are getting about 7-9 days between charges. When the battery gets low, we just plug it in overnight. There are incentives that Pennsylvania provides to put in publicly accessible Level 2 and 3 charging stations, which could include apartments and stores. More places are needed.
Let’s return to the economics of the electric car. On the negative side is the range and the higher initial cost. The base model Nissan Leaf Plus, with the 226 mile range, has an MSRP of $35,550. A base model Nissan Sentra, somewhat comparable, has an MSRP of $17,990. However, the MSRP is not the only number. Taking the available Federal Credits and Pennsylvania Rebate brings the MSRP down to $26,550. Secondly, EVs have a “fuel” economy about twice that of gas-powered vehicles. To drive 100 miles in a Leaf, you would use about 27.4 kWh, which at $0.1275 per kWh (Pennsylvania’s average), would put you out $3.49. The same Sentra, which gets a combined 30 mpg, would use 3.33 gallons of gas. At the current $2.70 per gallon, you would be spending $9.00. For a driver who puts 15,000 miles on a car a year, the savings in fuel would be $825 a year. Over 5 years, it would add up to over $4,000, to the advantage of the Leaf owner. So our $17,000 original differential between Leaf and Sentra is now more realistically $4,000. On top of that, you have a much simpler mechanical system, with no exhaust or catalytic converter, no fuel injectors, no radiator, no oil changes, etc. Kelly Blue Book puts the Leaf at around $250 less in maintenance over the first 5 years.
When we discuss a car in the terms of economics, we are usually buying transportation. We are not brand loyal, having owned a Toyota, Dodge, Plymouth, Mazda, Volvo, Subaru, Ford, and Buick. This usually means we are price sensitive, and so it was with this purchase. I had to wipe the drool off the Tesla Model S, or the Jaguar I-Pace. So although we were willing to pay more to reduce our carbon footprint, we were not willing to simply surrender bushels of money to make a point.
Ultimately, once we were all in, we see our responsibilities differently. Having now purchased an EV, we feel that our civic responsibility is to act as a resource and answer questions for others that might be curious. You might say we have become proselytizers for EVs.
The Bottom Line
If you are considering the next car, do not dismiss an EV as a choice. Ask yourself first, “Are you using this primarily for around town and do you have a second alternative for long trips? Do you have a place to charge an EV?” If the answers are yes, you may be a candidate for an EV. If you aren’t ready yet, consider paying attention to the market and emerging models. The direction is going to be toward electric and away from gasoline as we enter the 3rd decade of this century.